You could be forgiven for wondering if the constant barrage of bad news we’re hearing these days is ever going to end.
Between the effects of war in Ukraine, galloping inflation, rising interest rates and falling markets, the negativity can feel unrelenting. Never mind that by many measures the economy is actually performing pretty well – GDP growth remains healthy, employment has never been stronger and corporate profits are solid.
Still, there’s no doubt this year’s market declines have been unsettling for many people, especially because they’ve happened in all the major equity markets and in the bond market where the drop has been like nothing we’ve seen since the early 1980s.
The question is how best to react to this pullback. To try to answer that question, I recently looked at monthly returns from the S&P 500 index of large U.S. stocks all the way back to 1926. I asked the question what happened after the index had fallen by 15% or more from its peak – a decline reached by the S&P 500 when I looked at the data earlier this week. As of Wednesday’s close, it was down 16.0%.[1]
What I discovered should be instructive for anyone who might be considering jumping out of the market in hopes of buying back at lower prices “after the dust settles.”
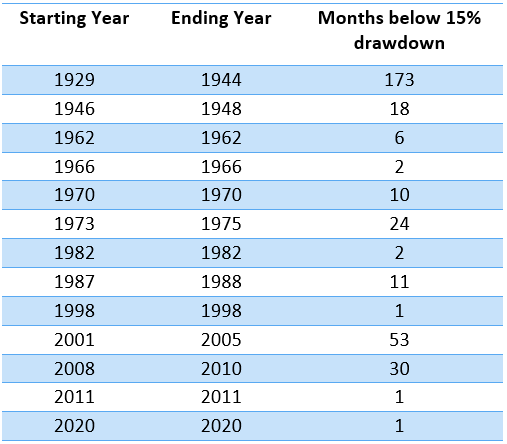
The accompanying chart shows how many months it took between the time the S&P 500 fell by 15% or more and when it regained that level. In other words, if you went to cash when the market was down 15%, how many months you would have had to buy back in before the trade turned unprofitable because the index had risen back above -15%.[2]

As you can see from the chart, there’s absolutely no consistency to the numbers. They range from the 173 months it took for the index to get back to -15% after the 1929 crash to the one month it took in 1998, 2011 and 2020.
Thus, judging from market history, there’s simply no way to know whether we will see the market bounce back in a month or two, or we’re in for a downturn that drags on like the ones in the early 1970s or 2000s.
In this light, how would you decide to get back into the market once you had sold? Any positive day could either be the beginning of a recovery or just a pause before the next leg down. And by selling, you expose yourself to the risk of missing out on the typically powerful stages of the next rally.
A study by Dimensional Fund Managers found that US$1,000 invested in the S&P 500 index in 1970 and held until August 2019 would have turned into $138,908. Miss the S&P 500’s five best days and the return would have shrunk to $90,171. Miss the 25 best days and the return would have dwindled to $32,763.[3]
Investors who try to time the market often make straight-line extrapolations into the future about how bad the damage of a downturn could get. The reality is that economies are dynamic and markets are continuously assessing how developments will affect the price of assets. Today’s avalanche of negative news can quickly and unexpectedly give way to a positive reassessment.

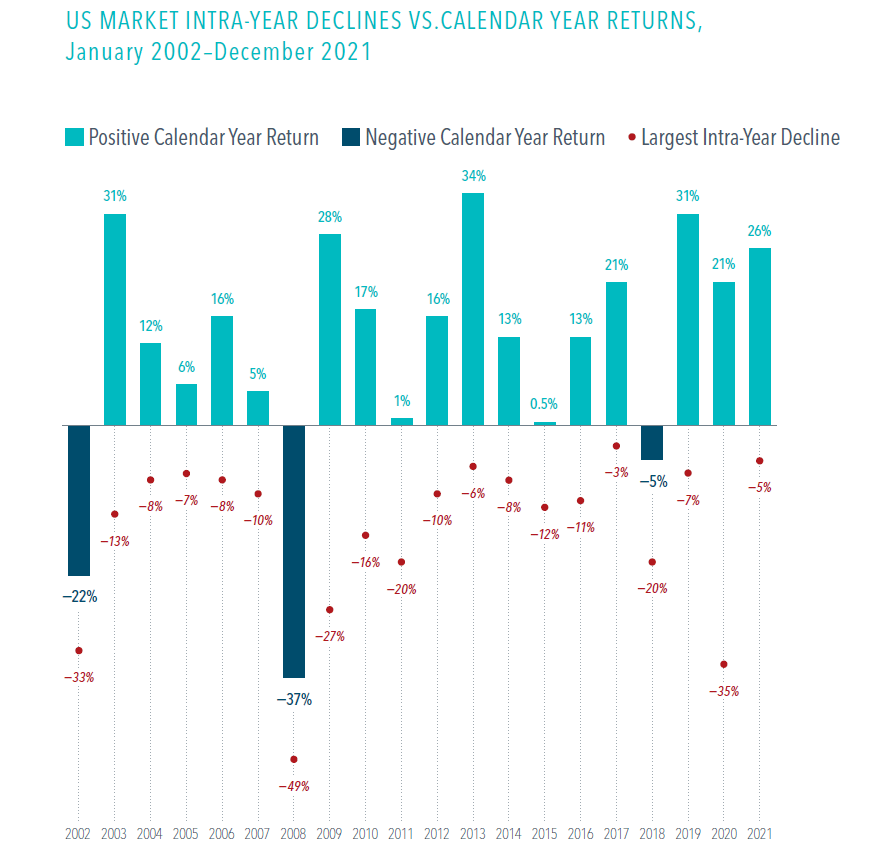
This chart from Dimensional shows the U.S. market had positive returns in 17 of the past 20 calendar years, despite suffering big declines during many of those years. In an accompanying article, Dimensional notes that in 2020, when the start of the pandemic caused a market crash, U.S. stocks ended the year with a 21% gain.
One thing we can say for sure about today’s market is that the S&P 500 is trading at a 16% discount from where it was at its peak. As Warren Buffett once said: “Whether socks or stocks, I like buying quality merchandise when it is marked down.”
For those who have cash to invest, I have no doubt that buying at a 16% discount will turn out to be good decision in hindsight five or ten years down the road (barring another Great Depression). That’s the sensible way to profit from a downturn.
[1] Source: S&P Dow Jones Indices
[2] Source: Dimensional Returns Web
[3] Source: Dimensional Fund Advisors